Uninstall QGIS in Windows and Linux
To uninstall QGIS on Windows can be done in the Control Panel-Add/Remove Program, and remove registrynya on:
\ \ HKEY_CURRENT_USER \ Software \ QuantumGIS \ qgis
and on Linux stored in the registry:
$ HOME / .config / QuantumGIS / qgis.conf
This is stored in the registry settings for display, WMS and PostGIS connection, which can be changed manually.
Monday, October 13, 2008 | 0 Comments
QGIS Installation (Linux-debian)
QGIS installation on Linux as Ubuntu, can be done as follows:
1) From the terminal run the command:
sudo etc / apt / sources.list
2) If using the version of Hardy Heron, then add the following sentence at the end of the source file list:
deb http://ppa.launchpad.net/qgis/ubuntu Hardy main
Save these changes, and then run the terminal command:
sudo apt-get update & & sudo apt-get install qgis
Then the window will appear to install QGIS same as in windows installation
Monday, October 13, 2008 | 0 Comments
QGIS Installation (Windows)
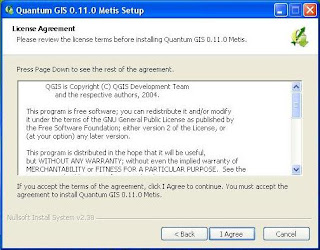
To perform the installation in Windows QGIS follow several steps:
1) Double click the icon QGIS.exe with a large 73.3 MB.
2) The new window will appear that contains the welcome speech. Here, the version shown QGIS that you install the version 0.11.0 with the code name Metis project. Then select Next.

4) Then you are asked to set the location of the installation. It is recommended to use a fixed location that has been written. Also shown that large files will be saved to your computer is 226.7 MB. Then select Next.
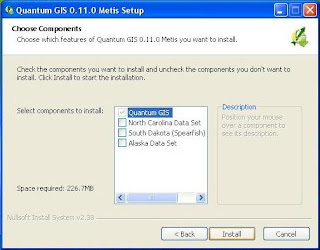
 5) Finally you will be shown tambaha window to select the components of the data sample. To ignore it at this time, because to get the components that require an internet connection. Choose the Install button to start the installation.
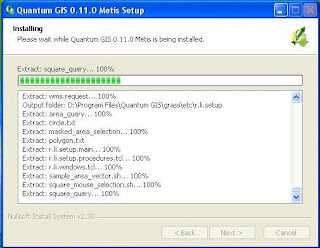
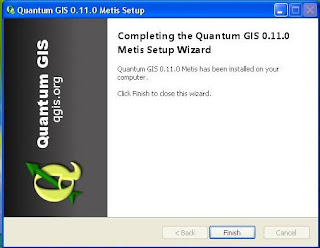
 6) Then, after terekstrak files to the location of the installation, then QGIS window will display the cover, which means that you have successfully installed QGIS.

Monday, October 13, 2008 | 0 Comments
Open Source GIS (Part.2)
QGIS
QGIS is one of GIS software with open source licensing under the GNU General Public License (GPL). That means that the source code used in building applications can we learn and change, and we can get for free. Unlike with commercial software in general, where the source code is closed so that the user can not develop their own application in accordance morning. QGIS is an abbreviation of Quantum Geographic Information System. GIS software is made starting in May 2002 and has been defined as projects in the SourceForge in June 2002. One of the advantages of this software QGIS is a lightweight and user-friendly. QGIS also has some version suitable with the platform, so it can run on Windows, Linux, and OSX. QGIS built using Qt and C + +. Early goal from making QGIS only as a viewer data only, but added with a growing variety of other plugin that works as a database management, spatial analysis, or to attach the display, so now QGIS not powerfull compared to other software such as ArcView GIS, or GRASS.
Monday, September 08, 2008 | 0 Comments
Open Source GIS (Part.1)
In addition QGIS still many other GIS software that can compete with commercial GIS software, which is currently dominated by ESRI. Open Source Applications (OS) SIG itself can be categorized into 2, namely the Library SIG OS and application OS SIG. Library GDAL such as GIS, the OS / ORG, Proj4, GEOS, GML4J, JTS, GeoTools, created with the goal of building a module in the application. GIS applications OS preferable to the interests of users in the GIS process. OS GIS applications can be divided into 3 types:
1) Desktop Applications. Such as: QGIS, GRASS, MapWindow, Thuban, OpenMap, ILWIS, etc..
2) Web-based applications. Such as MapServer, MapGuideOS, GeoServer, and DeeGree
3) Applications Database. Such as PostGIS
Monday, September 08, 2008 | 0 Comments
GIS Data and It's Projections (Part.2)
GIS maps produced is a projection from the earth surface geometry data with the actual situation in the 2.5 - 3 dimensions into 2-dimensional. Changes in the dimensions of this is done with little distortion, so the results may be achieved is not too much different with the form, distance and the actual area. There are various types of projection from the surface of the earth, roughly spherical flat as a flds cylinder / tube (cylindrical), cone (conical), flat field (zenithal) and composition (arbitrarry). However, the accuracy is close to the projected composition. Projection is obtained through the calculation.
In Indonesia, generally using the projected composition of the WGS-84 (World Geodetic System) and UTM (Universal Transverse Mercator). UTM projection is a projection map, which many in the select and use in the mapping activities in Indonesia because the value of the ideal syarat2 meet with the appropriate form, location and area of Indonesia. UTM projection in the entire surface of the earth is divided over the 60 called by the UTM zone. Each zone is limited by two meridian at 6 ° meridian and have their own midst. For areas of Indonesia is divided into nine zones UTM, starting from the meridian 90 ° with BT to 144 ° with BT limit pararel (latitude) 11 ° to 6 ° LS LU. Thus, starting from the Indonesian region a zone 46 (central meridian 93 ° BT) to zone 54 (central meridian 141 ° BT).
Saturday, September 06, 2008 | 0 Comments
Rasterization and Vectorization
In some GIS software, there are facilities to change the model data vectors into raster data (Rasterization) or otherwise change the model of raster data into the data vectors (Vektorization). This process is usually useful for instance when we will change the contours of a line (raster) into vector or change the regional map vectors into the surface raster. However, this process usually depends on the resolution of the original data.
Friday, September 05, 2008 | 0 Comments
Dimension of GIS Data
Dimensional spatial data can be divided in laminer (point or line), 2-dimensional (area), and 2.5 dimensions (with a value of the surface elevation). Building or buildings to include in 3 dimensions.
Thursday, September 04, 2008 | 0 Comments
The Advantages of GIS Data
Advantages of digital data in GIS is as follows:
1) Variation Data Display
Digital data variations have a view that is almost unlimited. Good shape,
color, size lines, symbols and text can be presented in accordance with the wishes
the map. Besides the changes can be done quickly
and reproduced in whatever amount in a short time.
2) Diversity and Combination
Digital spatial data, when combined with the diintergrasikan or other data
both spatial and non spatial data can generate a new digital spatial.
For example, spatial data type of soil, rainfall, slope, type of rock,
land use systems, land area and height if combined
with table conditions plants can produce the data level
suitability of land for certain crops.
3) Efficiency
Digital data can be accessed or used together by
several people at once for the different needs analysis.
4) Renewal
Digital data is relatively easier to update, using the facilities
editing existing. Unlike the data manually on the map of the analog (print map
paper).
Tuesday, September 02, 2008 | 0 Comments
GIS Data and It's Projections (Part.1)
Data used in GIS can be divided into 2 types of data geometry and attribute data.
1) Data geometry (spatial) showed a spatial (RELIGIOUS) an object. This condition is usually obtained with a spatial mencocokan position of the object with the circumstances of fact in the world. The determination of the geometry of a data point by using GPS (Global Positioning Satellite). Geometry data can be in the form of Raster (pixels) or Vector (Polygon / Area / Line / Point).
a) Raster Data is data that didimpan in a checker square (pixels) that form a field. Position pixels are 2 dimensions to the line with the stated-m-n to the column. This data has weaknesses because it takes too much memory and CPU, which require high processing for high when beresolusi as satellite imagery or photos from the air. Usually, this data is obtained through the process of scanning or shooting with a format like JPEG, tiff, BMP, etc..
b) Vector Data is data that is stored on a line or a polygon closed (the area). Polygon or a line formed by connecting the dots of coordinates (x, y) that have similar values. Because they are vectors of this data does not depend on the resolution. Vector Data consume less memory than raster data. Data stored in the form of the model data vectors, the relation between one object with another object is not saved. In order to be processed through the GIS model of this data must be converted to model saves the data correlation between objects, or through the topology.
Monday, September 01, 2008 | 0 Comments
GIS components
GIS as a system is a combination of various components that are integrated. GIS component consists of several stages in sequence, which include:
1) Input Data
2) Data Management
3) Manipulation and Data Analysis
4) Output Data
Sunday, March 09, 2008 | 0 Comments
GIS and It's History (Part.2)
HISTORY
GIS is the science that has been used since the days of ancient paintings which have been experiencing in the walls of Lascaux Cave, France made by the hunter CroMagnon contains about animals and route journey, which created around 35,000 years ago. In the year 1854, John Snow spread of disease information to make a point where cholera patients experiencing this disease, so it can be a source of disease and expansion.
Along with the creation of a map using pencil and paper, into the 20th century, especially in the years 1960an where people start to know computer technology, such as GIS can adapt to the progress of this technology. GIS tools to make this method of data processing and map making more quickly. Starting with computerized map of the separation profile into the layer-layer make savings of raw materials for a map and reduce error analysis lame collated (overlay). Previous overlay roughcast, also mapping data manually, so it will have difficulties when making the large scale and much of the data.
In 1962 SIG start felt important in the decision-making, this has already started with the formation of the project with the name "Canada Geographic Information System (CGIS) under the Ministry of Energy, Mines and Resources, chaired by Dr.Roger Tomlinson. The project is served in the store, analyze, and process the data collected form the Canadian Land Inventory (CLI-Canadian Land Inventory), which is then processed into a map of land use in rural areas in Canada. CGIS has been implementing various innovations, such as penstrukturan database, overlay, vektoisasi, making layers, and the distinction between data and spatial data attributes. Until the 1990s CGIS has mengupulkan much of the data of land in Canada. In the years 1960an also has applied GIS in the census held in the United States.
In the development of the GIS, terdapak 3 party that plays a role among other manufacturers of commercial, government, and education. At the end of 1960an until the mid-1970s, GIS has been developed and packaged through a variety of software. When the Harvard Laboratory for Computer Graphics and Spatial Analysis has been developing various software, among other SYMAP, CALFORM, SYMVU, grid, and so forth. Similarly, many developing GIS software developed by commercial companies such as ESRI (Environmental Systems Research Institute) of Arc / Info. Government more as the user provides input standard features of the software. GIS is usually used in military, defense, demographic, spatial and various cities other sectors.
Indonesia itself has adopted the GIS since Pelita to-2 when LIPI invite UNESCO in preparing the "Policy and Program Development Stage Second Five Year (1974-1979)" in the development of science, technology and research. Even now, there are already some GIS software has been developed by the company.
Saturday, February 09, 2008 | 0 Comments
GIS and It's History (Part.1)
GIS is an abbreviation of the Information System is the geographical information system to collect, store, analyze, manage, and display the data that has a geographic reference (georeference). GIS in the Indonesian language, also known as GIS (Geographic Information System). This system can be a collection of some of the software that is integrated to obtain information that is RELIGIOUS. Specifically GIS is a tool that can be used to search the data, analyze spatial information, manage data, maps and displays them in a certain view. In addition, when combined with the use of computers as a component of the current GIS, the GIS can also be interpreted as a computer-based system that is used to store, and analyze objects and phenomena-the geographic location where the phenomenon is a characteristic that important or critical analysis.
In addition to the above definition, there are some characteristics of the other GIS namely:
• is a collection of hardware, software, instructions and methods to capture, manage, manipulate and display information RELIGIOUSWith a variety of objectives that are RELIGIOUS information, GIS is a tool that can be used as scientific research, resource management, asset management, urban planning, product marketing, making maps and more. All the goals are used as materials for the decision based on information that has been poured through GIS. In this case GIS closely related to the product in the form of a map.
• is a decision support system
• broader function of mapping tools (Computer Aided-Cartography), Hope has the ability to analyze
• different from the CAD (Computer-Aided Design), because the reference RELIGIOUS (spatial)
• also different from the DBMS (Database Management System), because they have the interface to map data.
Wednesday, January 09, 2008 | 0 Comments
